

US Inflation Calculator


CPI | Gold | |
|---|---|---|
| Value in 2024 | $4,052.83 | $10,973.60 |
| Cumulative Price Change | 3,952.83% | 10,873.6% |
| $100.00 in Consumer Products in 1890 would be worth $4,053 in 2024 dollars. | $100.00 in Gold in 1890 would be worth $10,974 in 2024 dollars. |
Real Estate | |
|---|---|
| Value in 2024 | $8,733.46 |
| Cumulative Price Change | 8,633.46% |
| $100.00 in Real Estate in 1890 would be worth $8,733 in 2024 dollars. |
Value of $100.00 in 1890
Over Time
CPI | Gold | |
|---|---|---|
| Value in 2024 | $4,052.83 | $10,973.60 |
| Cumulative Price Change | 3,952.83% | 10,873.6% |
| $100.00 in Consumer Products in 1890 would be worth $4,053 in 2024 dollars. | $100.00 in Gold in 1890 would be worth $10,974 in 2024 dollars. | |
| Inflation-Adjusted Return | 0% | 170.76% |
| Annualized Inflation-Adjusted Return | 0% | 0.75% |
| Inflation-Adjusted Value in 2024 | $100 | $270.76 |
Real Estate | |
|---|---|
| Value in 2024 | $8,733.46 |
| Cumulative Price Change | 8,633.46% |
| $100.00 in Real Estate in 1890 would be worth $8,733 in 2024 dollars. | |
| Inflation-Adjusted Return | 115.49% |
| Annualized Inflation-Adjusted Return | 0.57% |
| Inflation-Adjusted Value in 2024 | $215.49 |
Inflation Update for June 12, 2024
Inflation in the U.S. was unchanged month-over-month and rose to 3.3% over the last 12 months in May 2024. The inflation rate, excluding food and energy, for May 2024 was 3.4% Year-Over-Year and 0.2% Monthly Change.
About the Inflation Calculator
This inflation calculator uses the Consumer Price Index For All Urban Consumers (CPI-U) published by the U.S. Bureau of Labor Statistics to calculate inflation from 1871 to 2024. This measures how prices of goods and services have changed over time, and can be used to see how the historical value of the US Dollar has changed as the cost of living has changed up to the present day. Different asset classes can be compared to see how they have performed after being adjusted for inflation.
Federal Reserve Board of Governors (FOMC) understands the harm of inflation on the economy. However, to control inflation, you must either reduce the demand for goods and services or increase the supply of goods and services. The FOMC is targeting an inflation rate of 2%. When inflation is higher than the target, the FOMC increases interest rates. This will encourage people to either borrow less money or save more and thus spend less. Spending less money is equivalent to demanding fewer goods and services.
The FOMC is doing their job by increasing interest rates. This will encourage people to either borrow less money or save more and thus spend less. Spending less money is equivalent to demanding fewer goods and services.
Rising interest rates also have inflationary effects as they may reduce investment and thus the economy's productive capacity. However, in modern economies where domestic consumption is the most important component of the gross domestic product, the effect of interest rates on demand is much greater than their effect on supply. Many government policies like sanctions, tariffs, and deficit spending are also inflationary. But controlling inflation is only one of many aims followed by politicians.
Current Inflation Data
US Inflation Rate
The US inflation rate is calculated by finding the 12-month percentage change in the Consumer Price Index (CPI). For example, to find the inflation rate for May 2024, you find the percentage change in the CPI for May 2024 compared to May 2023. The CPI increased from 304.13 in May 2023 to 314.07 in May 2024. Since that equals to a 3.3% increase, the US inflation rate for May 2024 was 3.3%.
US Inflation Rate (1960 - 2024)
| Year | Jan | Feb | Mar | Apr | May | Jun | Jul | Aug | Sep | Oct | Nov | Dec |
|---|---|---|---|---|---|---|---|---|---|---|---|---|
| 2021 | 1.40% | 1.67% | 2.62% | 4.15% | 4.93% | 5.32% | 5.26% | 5.18% | 5.36% | 6.22% | 6.86% | 7.18% |
| 2022 | 7.57% | 7.95% | 8.55% | 8.25% | 8.53% | 8.99% | 8.45% | 8.22% | 8.20% | 7.75% | 7.12% | 6.41% |
| 2023 | 6.36% | 5.97% | 4.94% | 4.94% | 4.12% | 3.05% | 3.27% | 3.72% | 3.69% | 3.25% | 3.14% | 3.32% |
| 2024 | 3.11% | 3.17% | 3.48% | 3.36% | 3.25% | To be released | ||||||
| 2017 | 2018 | 2019 | 2020 | 2021 | |
|---|---|---|---|---|---|
| Jan | 1.67% | 0.70% | 5.32% | 8.99% | 3.05% |
| Feb | 1.83% | 1.02% | 5.26% | 8.45% | 3.27% |
| Mar | 1.74% | 1.30% | 5.18% | 8.22% | 3.72% |
| Apr | 1.68% | 1.37% | 5.36% | 8.20% | 3.69% |
| May | 1.73% | 1.20% | 6.22% | 7.75% | 3.25% |
| Jun | 2.09% | 1.17% | 6.86% | 7.12% | 3.14% |
| Jul | 2.32% | 1.30% | 7.18% | 6.41% | 3.32% |
| Aug | 2.51% | 1.40% | 7.57% | 6.36% | 3.11% |
| Sep | 2.34% | 1.67% | 7.95% | 5.97% | 3.17% |
| Oct | 1.52% | 2.62% | 8.55% | 4.94% | 3.48% |
| Nov | 0.35% | 4.15% | 8.25% | 4.94% | 3.36% |
| Dec | 0.22% | 4.93% | 8.53% | 4.12% | 3.25% |
Core Inflation Rate
Core inflation in the United States is measured through the "Consumer Price Index for All Urban Consumers: All Items Less Food & Energy," called the Core CPI, removes food and energy from the CPI basket. Since food and energy prices are volatile and can change significantly, the core inflation rate is used to provide a better measure of where inflation is going in the long run.
The core inflation rate data is released monthly as part of the US. Bureau of Labor Statistics' monthly CPI data release. Changes in this rate will also impact i bond calculations.
Core Inflation Rate (1960 - 2024)
| Year | Jan | Feb | Mar | Apr | May | Jun | Jul | Aug | Sep | Oct | Nov | Dec |
|---|---|---|---|---|---|---|---|---|---|---|---|---|
| 2021 | 1.40% | 1.28% | 1.64% | 2.96% | 3.78% | 4.42% | 4.20% | 3.95% | 4.02% | 4.58% | 4.97% | 5.50% |
| 2022 | 6.06% | 6.45% | 6.48% | 6.16% | 6.02% | 5.90% | 5.90% | 6.30% | 6.64% | 6.29% | 5.96% | 5.68% |
| 2023 | 5.54% | 5.49% | 5.56% | 5.52% | 5.33% | 4.86% | 4.71% | 4.41% | 4.14% | 4.02% | 4.02% | 3.91% |
| 2024 | 3.87% | 3.76% | 3.80% | 3.62% | 3.41% | To be released | ||||||
| 2017 | 2018 | 2019 | 2020 | 2021 | |
|---|---|---|---|---|---|
| Jan | 2.07% | 1.18% | 4.42% | 5.90% | 4.86% |
| Feb | 2.17% | 1.55% | 4.20% | 5.90% | 4.71% |
| Mar | 2.32% | 1.71% | 3.95% | 6.30% | 4.41% |
| Apr | 2.33% | 1.71% | 4.02% | 6.64% | 4.14% |
| May | 2.34% | 1.63% | 4.58% | 6.29% | 4.02% |
| Jun | 2.35% | 1.66% | 4.97% | 5.96% | 4.02% |
| Jul | 2.29% | 1.62% | 5.50% | 5.68% | 3.91% |
| Aug | 2.27% | 1.40% | 6.06% | 5.54% | 3.87% |
| Sep | 2.38% | 1.28% | 6.45% | 5.49% | 3.76% |
| Oct | 2.10% | 1.64% | 6.48% | 5.56% | 3.80% |
| Nov | 1.45% | 2.96% | 6.16% | 5.52% | 3.62% |
| Dec | 1.24% | 3.78% | 6.02% | 5.33% | 3.41% |
What Is Inflation?
Inflation is a general rise of prices in an economy which eats away at the value of the dollar. That’s because when prices rise for the same goods and services, consumers are getting less for their money. This is also known as a loss of purchasing power, as one dollar will be able to buy less and less in the future due to inflation. A loss of purchasing power should be considered when estimating the return on investment as well as the present value of your investments.
Deflation is the opposite of inflation. Instead of prices being “inflated”, deflation is when prices “deflate”, or decrease. Inflation is more common than deflation in a healthy economy. Deflation is generally seen as worse than inflation. However, high levels of inflation is also bad for an economy. That’s why the US Federal Reserve has an inflation target of 2%, which keeps inflation low, but not low enough to threaten deflation.
How Is Inflation Measured?
There are many different ways to measure inflation, but the most popular way to calculate inflation is by using the Consumer Price Index (CPI). As the name suggests, the CPI is an index that measures the prices that consumers pay at a certain point in time. Inflation is calculated by measuring how much the CPI changes over a period of time.
More specifically, the Consumer Price Index measures prices of a basket of goods and services that make up the average American’s cost-of-living. The CPI is made up of eight major groups of consumer expenditures:
- Food
- Housing
- Apparel
- Transportation
- Medical Care
- Recreation
- Education and Communication
- Other Goods and Services
CPI only includes goods and services that can be consumed. That means that CPI doesn't include investments, such as stocks or real estate. Home prices do not affect CPI.
Core Inflation
CPI including food and energy measures what is called headline inflation. Core inflation is from the CPI excluding food and energy.
Food prices and energy prices are volatile, and so they can drastically affect inflation rates. This might be from temporary shocks or events that affect food or energy prices, or it may even just be effects of seasonality on prices. Since inflation is meant to measure the change in price levels over a period of time, having volatile components can distort the inflation rate. Core inflation, which excludes food and energy, gives a better sense of inflation trends.
Just like there are different measures of inflation, there are different types of CPIs. The most widely used is the CPI for All Urban Consumers (CPI-U). The CPI-U is what is commonly referred to as the CPI. This index measures price levels in 75 urban areas accounting for 93% of the US population. This index does not include rural consumers.
Other types of CPI include the CPI for Urban Wage Earners and Clerical Workers (CPI-W), which only includes urban households that are employed and paid wages, and the Chained CPI which accounts for changes in consumer spending patterns.
| Items and Groups | U.S. City Average, CPI-U | U.S. City Average, CPI-W | |||
|---|---|---|---|---|---|
| All items | 100 | 100 | |||
| Food and beverages | 14.409 | 15.95 | |||
| Food | 13.555 | 15.235 | |||
| Food at home | 8.167 | 9.572 | |||
| Food away from home | 5.388 | 5.663 | |||
| Housing | 45.065 | 43.14 | |||
| Shelter | 36.191 | 34.194 | |||
| Rent of primary residence | 7.671 | 10.458 | |||
| Owners' equivalent rent of residences | 26.769 | 22.504 | |||
| Owners' equivalent rent of primary residence | 25.44 | 21.871 | |||
| Transportation | 15.898 | 17.925 | |||
| Private transportation | 14.828 | 17.119 | |||
| New and used motor vehicles | 6.42 | 6.606 | |||
| Apparel | 2.512 | 2.588 | |||
| Recreation | 5.307 | 4.444 | |||
| Medical care | 8.004 | 6.896 | |||
| Medical care services | 6.515 | 5.653 | |||
| Education and communication | 5.906 | 5.96 | |||
| Commodities | 35.985 | 38.97 | |||
| Commodities less food and beverages | 21.576 | 23.02 | |||
| Commodities less food and energy commodities | 18.891 | 19.123 | |||
| Nondurables less food and beverages | 11.276 | 12.788 | |||
| Nondurables less food, beverages, and apparel | 8.764 | 10.2 | |||
| Durables | 10.301 | 10.232 | |||
| Services | 64.015 | 61.03 | |||
| Services less rent of shelter | 28.237 | 27.232 | |||
| Services less medical care services | 57.499 | 55.377 | |||
| Rent of shelter | 35.778 | 33.798 | |||
| Transportation services | 6.294 | 6.94 | |||
| Other services | 9.83 | 8.845 | |||
| Services less energy services | 60.899 | 57.427 | |||
| All items less food | 86.445 | 84.765 | |||
| All items less shelter | 63.809 | 65.806 | |||
| All items less medical care | 91.996 | 93.104 | |||
| Commodities less food | 22.43 | 23.735 | |||
| Nondurables | 25.685 | 28.738 | |||
| Nondurables less food | 12.129 | 13.503 | |||
| Nondurables less food and apparel | 9.617 | 10.915 | |||
| Energy | 6.655 | 8.214 | |||
| All items less energy | 93.345 | 91.786 | |||
| All items less food and energy | 79.79 | 76.551 | |||
| Domestically produced farm food | 6.798 | 7.832 | |||
| Utilities and public transportation | 7.63 | 8.38 | |||
CPI measures housing costs. Housing costs include
- Shelter,
- Utilities and Fuels, and
- Household Operations.
The largest component of housing costs in the CPI is "shelter," which is further divided into
- a. Rent of Primary Residence,
Rental Costs: This subcomponent measures the change in rent prices for tenants. The BLS collects data on rental rates for different types of housing units, and tracks changes over time. - b. Owners' Equivalent Rent (OER),
Homeownership Costs: Since most homeowners do not pay rent, the BLS uses the concept of owners' equivalent rent to estimate the cost of homeownership. OER is based on the amount homeowners would need to pay to rent their own home, capturing the implicit rent they are “paying” themselves. Housing costs for homeowners do not take into account their mortgage costs or any appreciation or depreciation in their home value. - c. Lodging Away from Home.
Temporary Housing: This includes expenditures on hotels, motels, and other short-term lodging.
Different countries use different methods for capturing housing costs when calculating inflation rates. The United States uses the rental-equivalence approach, which is also used by Germany, Japan, and the United Kingdom, among others. The other way to measure housing costs is the user-cost approach, which is used by Canada and Sweden.
With the user-cost approach, the cost of housing is based on the cost of renting or owning the home. For renters, this includes their monthly rent and any tenant's insurance premiums. For homeowners, this includes their mortgage interest cost, property taxes, home insurance, and maintenance. The user-cost also accounts for the cost of utilities, such as water, gas, and electricity.
Why doesn’t CPI include housing prices?CPI measures the cost of goods and services that are consumed in a period of time. When someone purchases a home, they are “consuming” their purchase over a period of many years. Not all consumers will also be buying a home within a certain period of time, which makes it not reflective of the cost of living for all consumers.
The United States uses monthly rent instead of housing prices since rent is paid by consumers every month, while a consumer won’t be buying a home every month. For existing homeowners, the equivalent rent that it would cost to rent out their home is used to estimate how much they would have to pay to live in that home every month.
Some countries do include the price of houses into their CPI, which is called the net acquisition approach. This includes Australia and New Zealand.
Why does the CPI matter?CPI is the official measure of inflation. As a result, some contractual payments and some legislated payments are adjusted based on changes in CPI. For example, payments of some government assistance programs including social security are tied to the CPI; that is to say social security and some other assistance payments increase in line with CPI. Also, the salaries of military and federal civil service retirees are tied to the value of the CPI. Furthermore, tax brackets are adjusted based on changes in the value of CPI so that inflation does not increase taxes.
Is CPI a good metric for inflation?The general idea behind the CPI is to build a basket of goods and services and then consider changes in the price of this basket as inflation. In building this basket there are many decisions involved. Different values are derived for the inflation rate depending on the decisions of what to include in the CPI basket. For example, BLS argues that since houses are not consumed they should not be included in the CPI basket. However, some would argue that having a house is their dream and their psychological well-being depends on the expectation that they will be able to buy a house. If owning a house is a necessity then it should be included in the CPI basket.
Another issue with the CPI reported by BLS is that it is not reflecting the price of a fixed basket of goods. Every year in December, BLS publishes the most recent composition of the CPI basket. The composition of the CPI basket changes with spending by US consumers. For example, the basket items will change if increasing prices cause consumers to substitute one product for another (a cheaper product substituting for a more expensive product). As a result, the change in basket composition will undermine the inflation estimation because it will no longer track the increasingly expensive item.
In short, changes in the methodology of measuring CPI by BLS have caused CPI to be more indicative of the cost of living and not necessarily a good measure for changing the purchasing power of the dollar. Most people in the western world are accustomed to low inflation. When inflation is low these methodological changes have rather small effects. Even in hypothetical situations when employment numbers and wages are rising considerably faster than prices these changes might cause an overestimation of inflation. In today's conditions or those in the early 1980s, these changes cause considerable underestimation of inflation.
CPI Release Dates
CPI data is released monthly by the U.S. Bureau of Labor Statistics, usually between the 10th and 13th of every month. CPI data releases are always scheduled for 8:30 am on release day. The CPI data released is for the preceding month. For example, the data release on December 13, 2022 is CPI data for the month of November 2022. Here are the scheduled CPI release dates for 2022.
CPI Data Release Schedule for 2024
| CPI Data for the Month Of | Release Date | Release Time |
|---|---|---|
| January 2024 | Feb. 13, 2024 | 08:30 AM |
| February 2024 | Mar. 12, 2024 | 08:30 AM |
| March 2024 | Apr. 10, 2024 | 08:30 AM |
| April 2024 | May 15, 2024 | 08:30 AM |
| May 2024 | Jun. 12, 2024 | 08:30 AM |
| June 2024 | Jul. 11, 2024 | 08:30 AM |
| July 2024 | Aug. 14, 2024 | 08:30 AM |
| August 2024 | Sep. 11, 2024 | 08:30 AM |
| September 2024 | Oct. 10, 2024 | 08:30 AM |
| October 2024 | Nov. 13, 2024 | 08:30 AM |
| November 2024 | Dec. 11, 2024 | 08:30 AM |
Source: U.S. Bureau of Labor Statistics CPI Release Schedule
Inflation Calculations, Formulas, and Examples
How to Calculate Inflation
The percentage change in CPI is used to calculate inflation. To calculate inflation, you will first need to find the CPI for the years that you want to compare. The percentage change in CPI is the cumulative inflation between these years.
For example, the CPI in January 2010 was 216.69, while the CPI in January 2020 was 257.97. The percentage change is 18.97%. During this 10-year period, inflation was 18.97%. An item in 2020 costs 18.97% more than it did back in 2010. In other words, prices in 2020 are 18.97% higher than they were in 2010.
Has there ever been deflation in the US?While there hasn’t been major deflationary periods in the US in recent history, there has been major deflation in the past, most notably during the Great Depression in the 1930’s. Between 1929 and 1933, the US CPI fell from 17.10 in 1929 to a low of 12.60 in 1933. This represents a deflation rate of 26.3% over a period of just five years!
In recent times, there have been brief periods of deflation in the US. The Great Recession in 2008 and 2009 brought about deflation, bringing the CPI from 219.09 in August 2008 to 215.83 in August 2009, or just under 1.5% deflation in one year.
The most recent deflation experienced was in early 2020 as the pandemic caused consumer spending to crater. The CPI fell from 258.68 in February 2021 to 256.39 in May 2021, for a slight deflation rate of 0.88% for a four-month period. However, the CPI then quickly rose afterwards, meaning that the trailing twelve month inflation rate did not dip into negative territory to signal deflation.
How Is Current US Inflation Rates Calculated?
The current US inflation rate is calculated using the last 12 months of the CPI. This is known as the trailing 12 months. To calculate the current inflation rate as a formula:
Current US Inflation Rate =
x 100
For example, let’s calculate the US inflation rate as of September 2021. We would first need to look at the CPI values for September 2021 and September 2020.
| Month | CPI |
|---|---|
| September 2020 | 260.28 |
| October 2020 | 260.39 |
| November 2020 | 260.23 |
| December 2020 | 260.47 |
| January 2021 | 261.58 |
| February 2021 | 263.01 |
| March 2021 | 264.88 |
| April 2021 | 267.05 |
| May 2021 | 269.20 |
| June 2021 | 271.70 |
| July 2021 | 273.00 |
| August 2021 | 273.66 |
| September 2021 | 273.98 |
From this table, we see that:
- CPI for September 2020: 260.28
- CPI for September 2021: 273.98
Inputting this into the inflation rate formula:
Current US Inflation Rate =
x 100
Current US Inflation Rate = 5.2635%
The US inflation rate as of September 2021 is 5.26%.
How Does This Calculator Find The Value of a Dollar?
This inflation calculator finds the value of a dollar by using the difference in CPI between the two points. That’s because the difference in CPI measures the difference in purchasing power. If the CPI is now higher, this means that the price of goods and services are now more expensive for the same unit of currency. One dollar back then would have bought more goods and services then it would have today, which means that it would be more valuable.
For example, let’s look at the change in the value of the US Dollar from January 1871 to January 2021.
- Find the CPI of the starting date and the ending date
In January 1871, the CPI was 12.46. In January 2021, the CPI was 261.58
- Find the percentage change in the CPI values
Percentage Change =
Ending Value - Starting ValueStarting Valuex 100
CPI Percentage Change =
261.58 - 12.4612.46x 100
CPI Percentage Change = 1,999.36%
- Apply the percentage change to the dollar amount
In this case, we’re only looking at the change in the value of one US Dollar.
$1 + $1 * 1,999.36% = $20.99
$1 in 1871 would be worth $20.99 in 2021.
If we look at $100 in 1871:
$100 + $100 * 1,999.36% = $2,099.36
$100 in 1871 would be worth $2,099.36 in 2021.
How do I calculate how much an item would have cost in the past?
Just like how CPI can be used to calculate how much a dollar in the past is worth today, CPI can also be used to calculate how much a dollar today is worth in the past. While the cost of specific items have changed, and consumption has also changed, this is a way to see how much a certain amount of money today would have been in the past.
Let’s look at $100 in January 2021 compared to January 1890. You can use the inflation rate calculator above or you can follow these steps to calculate it manually. If you bought an item for $100 in 2021, how much would it have cost you if you bought it in 1890? Rather, how much would $100 of goods and services in 2021 have cost in 1890?
- Find the CPI of the starting date and the ending date
In January 1890, the CPI was 7.61. In January 2021, the CPI was 261.58.
- Find the percentage change in the CPI values
Percentage Change =
Ending Value - Starting ValueStarting Valuex 100
CPI Percentage Change =
7.61 - 261.58261.58x 100
CPI Percentage Change = -97.09%
- Apply the percentage change to the dollar amount
The percentage change is negative since you are going from a higher CPI value to a lower CPI value. This deflates the dollar amount.
$100 - 97.09% = $2.91
A $100 item in 2021 would have cost $2.91 in 1890. In other words, $100 in 2021 would buy the same amount of goods and services that $2.91 would have bought in 1890.
How to calculate the annual average inflation rate
To calculate the average annual inflation rate, you will need to find the compound annual growth rate (CAGR). That's because inflation and deflation compounds over time.
CAGR = Average Annual Inflation Rate = ((FV / PV)1 / t - 1) x 100%
Where:
FV = Amount in End Year
PV = Amount in Initial Year
t = Number of Years
For example, let's calculate the average US annual inflation rate using the above formula between 1890 and 2021.
- Calculate the values in the initial year and end year
This uses the same calculation to find the value of a dollar. Let’s say that we’re looking at $100 in 1890, which means that we will need to find the value of $100 in 1890 in 2021 dollars.
- CPI in January 1890 = 7.61
- CPI in January 2021 = 261.58
- Percentage change = 100 x (261.58-7.61)/7.61 = 3,337.32%
- $100 + $100*3,337.32% = $3,437.32
- Result: $100 in 1890 (PV) is worth $3,437.32 in 2021 (FV)
- Find the number of years
2021 - 1890 = 131 years
This average annual inflation rate will be for a period of 131 years.
- Use the CAGR formula to calculate the average annual inflation rate
Average Annual Inflation Rate = ((3,437.32 / 100) (1 / 131) - 1) x 100%
Average Annual Inflation Rate = 2.737%
The average annual inflation rate in the US from 1890 to 2021 was 2.737%.
What is inflation-adjusted return?
An inflation-adjusted return is the rate of return for an investment or cash flow after inflation has been taken out. Since inflation is when prices rise in an economy, inflation also increases the value of investments, such as stocks or commodities. Inflation-adjusted return is important since it calculates the real rate of return that is independent of inflation, or in other words, the performance of the investment above the rate of inflation. That’s why the inflation-adjusted return is also called the real rate of return.
Hedges Against Inflation
An investment might have a positive rate of return, but it doesn’t tell us much if we don’t consider the effects of inflation. If the investment had a return of 5%, but inflation over the same time period was 10%, then the investment actually has a negative inflation-adjusted return. The investment couldn’t keep up with inflation, and so it lost value.
Investments and assets that have a positive inflation-adjusted return can be considered to be hedges against inflation. Some investments, such as i bonds change their ROI to match inflation rates. By putting money into inflation hedges, you’re protecting your purchasing power in the future. However, they work better as long-term hedges against inflation, as they can still experience short-term fluctuations. Common examples of hedges against inflation include stocks, real estate, and commodities. This can include metals such as gold and silver.
How to Calculate Inflation-Adjusted Return
To calculate inflation-adjusted return, you will need to get the dollar values of what you are trying to adjust. Let's look at the inflation-adjusted return for the stock market from 1890 to 2021. Between 1890 and 2021, $100 in the stock market would have grown to $70,515.80 excluding dividends. This is a cumulative rate of return of 70,415.80%, however, we want to adjust this return to account for inflation. During the same time, the value of $100 in 1890 would be worth $3,437.32 in 2021.
- Base Values: $100
- Stock Market Value in 2021: $70,515.80
- CPI Dollar Value in 2021: $3,437.32
The formula to calculate inflation-adjusted return is:
x 100
=
x 100
The inflation-adjusted return for the stock market between 1890 and 2021 would be 1,951.47%
How to Calculate Annualized Inflation-Adjusted Return
Annualized inflation-adjusted return is the adjusted rate of return that is stated as an annual rate. This allows the return to be compared between different time periods, such as when the lengths of the time periods being compared are different.
To calculate the annualized inflation-adjusted rate of return, you will need to use the CAGR formula. Using the same example as above for the stock market:
- $100 in 1890
- Inflation-Adjusted Return = 1,951.47%
- Inflation-Adjusted Value = $2,051.47
Annualized Inflation-Adjusted Return = ((2,051.47 / 100)(1 / 131) - 1) x 100%
Annualized Inflation-Adjusted Return = 2.333%
The annualized inflation-adjusted return for the stock market from 1890 to 2021 is 2.333%, excluding dividends.
A Guide to the Consumer Price Index
What Is in the Consumer Price Index?
The components that make up CPI and are included in the CPI-U are grouped into expenditure categories and sub-groups. The item that has the highest weight in CPI is housing. In some cities, housing expenditures make up over 50% of the CPI. The main expenditure categories that make up CPI are:
- Housing
- Food and beverages
- Transportation
- Medical care
- Education and communication
- Recreation
- Apparel
- Other goods and services
These categories can be further broken down into subcategories. For example, food can be categorized as either food at home or food away from home. Food at home can then be further categorized into various different types of foods, and then into individual food items. As an example, apples would fall under fresh fruits and vegetables. In 2020, apples made up 0.073% of the CPI basket of goods and services.

The CPI Basket Weight Calculator below can be used to find the weighting that a component or specific item has when calculating the CPI, based on the latest published weighting in 2020.
CPI Basket Weight Calculator
CPI Weight: 0% of CPI
How Is CPI Weighted?
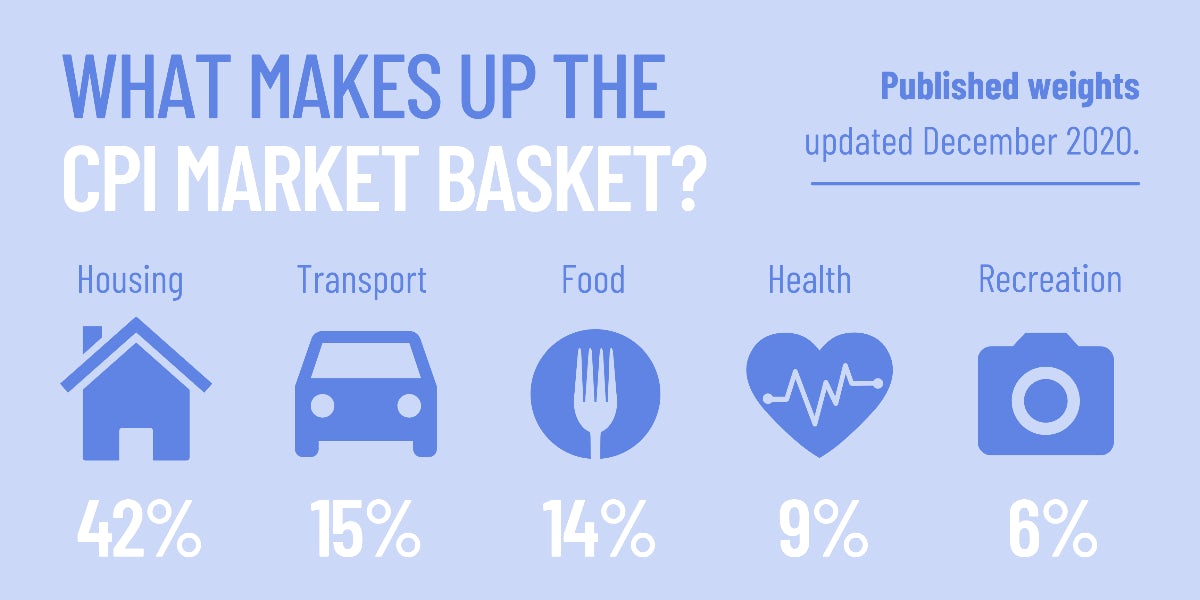
Once a year in December, the Bureau of Labor Statistics (BLS) publishes their weighting for each component of the Consumer Price Index (CPI). This weighting determines how much a price change in a specific category would affect the overall CPI. The weighting of each component, called relative importance, is based on the average annual expenditures of an average consumer in a certain area.
From 2010 to 2020, health and medical care spending steadily grew its CPI basket weight from 6.6% in 2010 to 8.9% in 2020. Transport and recreation declined over the same time period, while food and housing remained roughly the same.
US CPI Basket Weights by Year (2010 - 2021)
| Year | Food | Housing | Transport | Health | Recreation |
|---|---|---|---|---|---|
| 2021 | 13.4 | 42.4 | 18.2 | 8.5 | 5.1 |
| 2020 | 14.1 | 42.4 | 15.2 | 8.9 | 5.8 |
| 2019 | 13.8 | 42.1 | 15.7 | 8.8 | 5.8 |
| 2018 | 13.3 | 42.2 | 16.3 | 8.7 | 5.7 |
| 2017 | 13.4 | 41.8 | 16.5 | 8.7 | 5.7 |
| 2016 | 13.7 | 42.6 | 15.3 | 8.5 | 5.7 |
| 2015 | 14 | 42.2 | 15.2 | 8.4 | 5.7 |
| 2014 | 14.3 | 42.2 | 15.3 | 7.7 | 5.8 |
| 2013 | 13.9 | 41.4 | 16.4 | 7.6 | 5.8 |
| 2012 | 14.3 | 41 | 16.8 | 7.2 | 6 |
| 2011 | 14.3 | 41 | 16.9 | 7.1 | 6 |
| 2010 | 13.7 | 41.5 | 17.3 | 6.6 | 6.3 |
Estimating Monthly CPI Weights
While the CPI weighting is updated once every year in December, the weighting for each category will need to be estimated for all other months. To do so, you would need to find the percentage change in the price index of that category. You would then add that percentage change to the weight. Then, you would adjust it by normalizing the estimated weight for all items to 100, and then applying it to the category you are looking to estimate.
For example, let's say that the published relative importance (weight) of Housing in December 2021 was 40%, and the price index for Housing was 300 in December 2021. It is now June 2022 and you want to estimate the weight that Housing would have in the June 2022 CPI calculation. The price index of Housing is now 350 in June 2022. The price index for all items has also increased from 250 in December 2021 to 260 in June 2022. We now have the following information:
| Item | Published Weight (December 2021) | Index (December 2021) | Index (June 2022) |
|---|---|---|---|
| Housing | 40 | 300 | 350 |
| All Items | 100 | 250 | 260 |
To estimate the CPI weight of Housing in June 2022, the steps would be:
- Find the percentage changes in the price index
The price index for Housing has increased 16.66% from 300 to 350.
The price index for All Items has increased 8% from 250 to 270.
- Apply the percentage change of the price index to the latest published weight
The weight of Housing would increase 16.66% from 40 to 46.66.
The weight of All Items would increase 8% from 100 to 108.
- Adjust the weight of Housing based on All Items being normalized to 100
Since the weight of All Items can’t be more than 100, we have to normalize it back to 100. We then apply this adjustment to the weight of Housing.
Estimated Weight of Housing = (Updated Weight of Housing / Updated Weight of All Items) x 100
Estimated Weight of Housing = (46.66 / 108) x 100 = 43.00
The estimated CPI weight of Housing in June 2022 is 43.0%.
While the price index of Housing had increased by 16.66%, the weight of Housing relative to All Items only increased by 7.5%. That’s due to the price index of All Items increasing by 8%.
Result of the Example of Estimating CPI Weights
| Item | Housing | All Items |
|---|---|---|
| Published Weight (December 2021) | 40 | 100 |
| Index (December 2021) | 300 | 250 |
| Index (June 2022) | 300 | 250 |
| Updated Weight (June 2022) | 46.66 | 108 |
| Estimated Weight (June 2022) | 44.86 | 100 |
Estimating Contributions to Percentage Change of CPI
Since we know the relative weight of each component, we are able to estimate the contribution that they have to the overall CPI. Let’s use the example from above, but now assume June 2022 was December 2022. From the example above, the CPI increased by 8% over a 12-month period, which means that the inflation rate was 8%. How much of that 8% inflation was due to the change in prices of Housing?
To estimate the contribution of a specific component, in this case Housing, the steps would be:
- Estimate the updated weights
You will need to follow the same steps as in the previous example to get the updated weights of both Housing and for All Items, and not the estimated weight. This means that the last step, where the updated weight of housing is adjusted, would be skipped.
From the previous example, the updated weight of Housing is 46.66, and the updated weight of All Items is 108.
- Calculate the change in weights
The weight of Housing increased by 6.66, from 40 to 46.66.
The weight of All Items increased by 8, from 100 to 108.
- Divide the change in weight of the component by the change in weight of All Items
The ratio between the change in weight of Housing and the change in weight of All Items gives us the contribution that Housing had on the change in All Items.
Contribution = 6.66/8
Contribution = 83.25%
In this example, Housing contributed to 83.25% of the change in the CPI. In other words, Housing contributed to 83.25% of inflation in this example.
- Calculate the change in weights
Since this calculation is for a 12-month period starting from December when the published weights are released, we do not need to use multiple published weights. If your calculation involves a time period that has more than one January, then you would need to calculate the contribution in two parts: one with the old published weight and one with the new published weight.
For example, if you wanted to find the contribution of Housing to inflation from December 2021 to December 2022, you would only need to use the published weights as of December 2021. If you wanted to calculate from November 2022 to February 2024, you would need to use the published weights for December 2021 (Nov. 2022 to Dec. 2022), December 2022 (Dec. 2022 to Dec. 2023), and December 2023 (Dec. 2023 to Feb. 2024).
U.S. City CPIs
Each metro area has their own Consumer Price Index. The Consumer Price Index for All Urban Consumers (CPI-U) U.S. City Average takes the average of all U.S. cities and is commonly the number you will hear when U.S. inflation data is mentioned. The weighting of the CPI can vary significantly from city to city.
For example, food and beverages made up 16.27% of the Los Angeles CPI in 2020, but only 11.61% of the Miami CPI. This shows that the average consumer in Los Angeles spends more on food and beverages every year, which is why that category makes up a larger percentage of the CPI basket. Price changes in food and beverages have a higher relative importance in Los Angeles.
Another example can be seen in housing, which is the largest component of the CPI. The weighting of housing in San Francisco’s CPI is 53.213% in 2020, but housing only has a weighting of 39.147% in Detroit’s CPI.
Comparing CPI Basket Weights by City (2021)
| City | Food | Housing | Transport | Health |
|---|---|---|---|---|
| Seattle | 13.1% | 45.2% | 15.2% | 6.6% |
| Phoenix | 13% | 45.6% | 18.8% | 7.8% |
| Denver | 12.5% | 44.6% | 17.6% | 7.3% |
| Dallas | 11.4% | 46.9% | 16.8% | 8.6% |
| Houston | 14.3% | 42.8% | 17.9% | 8.1% |
| Chicago | 16.7% | 42.3% | 15% | 9.4% |
| Detroit | 14.6% | 40.1% | 18% | 8.4% |
| Atlanta | 15.8% | 42.7% | 17% | 8.1% |
| Miami | 11.5% | 48.4% | 19% | 7.6% |
| Washington D.C. | 13.9% | 44.6% | 15.1% | 8.4% |
| New York City | 14.8% | 45.7% | 14.5% | 6.8% |
| Los Angeles | 14.7% | 48.2% | 15% | 6.6% |
| San Francisco | 13.9% | 51.7% | 13.3% | 6.3% |
| Boston | 12.2% | 45.9% | 15% | 8.1% |


How Do Other Countries Weight CPI?
Other countries have their own price indices with basket weights that reflect their country’s own spending habits. For example, while housing made up 42% of the CPI in the United States in 2020, housing made up only 15% of France's CPI basket, 24% of Australia’s CPI basket, 30% of Canada’s CPI basket, and 30% of UK’s CPI basket in 2020.
Countries also have their own CPI basket weighting updates. For example, while the United States, France, Australia, Russia, and the UK update their CPI baskets every year, Canada only updates their CPI weighting once every two years. Meanwhile, China’s National Bureau of Statistics updates their CPI weighting once every five years.
The table below compares CPI basket weights by country. The country that weighs food most heavily is India, with it making up 44.6% of their CPI basket, while the lowest was the United Kingdom with an 8.8% weighting. Housing had the highest importance in the United States and the least in India.
Comparing CPI Basket Weights by Country (2020)
| City | Food | Housing | Transport | Health |
|---|---|---|---|---|
| United States | 14.1% | 42.4% | 15.2% | 8.9% |
| Canada | 16.3% | 25.9% | 20.1% | 5% |
| United Kingdom | 8.8% | 29.6% | 12% | 2.2% |
| France | 15.8% | 15.3% | 13.3% | 11.2% |
| Australia | 16.3% | 24.1% | 10.2% | 6.3% |
| Japan | 26.3% | 21.5% | 15% | 4.8% |
| China¹ | 19% | 20.4% | 10.6% | 10.3% |
| India² | 44.6% | 10.1% | 8.6% | 5.9% |
| Brazil³ | 21.6% | 18.2% | 20.8% | 10.7% |
| Mexico⁴ | 27.6% | 22.1% | 14% | 6.7% |
1: Estimated for 2020 by CEIC Data
2: Last updated in 2015 by India’s Ministry of Statistics & Programme Implementation
3: Monthly weights for December 2021 by the Government of Brazil
4: Last updated in 2018 by the Government of Mexico
Current Inflation Rates for Various Items
Food Inflation
The current food inflation rate for July 2022 is 10.93%. This is the highest food inflation rate since 1981.
This change in food prices include prices of fruits and vegetables, meats, poultry, fish, and eggs, dairy, cereals and bakery products, frozen food, snacks, candy, and food away from home, based on U.S. Dollars.
Food Inflation Rate (1914 - 2022)
| Year | Jan | Feb | Mar | Apr | May | Jun | Jul | Aug | Sep | Oct | Nov | Dec |
|---|---|---|---|---|---|---|---|---|---|---|---|---|
| 2021 | 3.78% | 3.62% | 3.47% | 2.37% | 2.15% | 2.39% | 3.45% | 3.74% | 4.59% | 5.33% | 6.11% | 6.27% |
| 2022 | 6.95% | 7.89% | 8.79% | 9.38% | 10.15% | 10.44% | 10.93% | To be released | ||||
Source: U.S. Bureau of Labor Statistics CPI for Food, U.S. City Average
| 2017 | 2018 | 2019 | 2020 | 2021 | |
|---|---|---|---|---|---|
| Jan | 1.12% | 1.43% | 1.71% | 4.13% | 3.74% |
| Feb | 1.24% | 1.35% | 1.79% | 3.95% | 4.59% |
| Mar | 1.33% | 1.19% | 2.07% | 3.93% | 5.33% |
| Apr | 1.39% | 1.40% | 2.00% | 3.70% | 6.11% |
| May | 1.59% | 1.58% | 1.81% | 3.93% | 6.27% |
| Jun | 1.66% | 1.61% | 1.81% | 3.78% | 6.95% |
| Jul | 1.40% | 1.96% | 1.81% | 3.62% | 7.89% |
| Aug | 1.29% | 2.12% | 1.93% | 3.47% | 8.79% |
| Sep | 1.39% | 1.78% | 3.51% | 2.37% | 9.38% |
| Oct | 1.23% | 1.98% | 4.00% | 2.15% | 10.15% |
| Nov | 1.43% | 1.91% | 4.54% | 2.39% | 10.44% |
| Dec | 1.41% | 1.78% | 4.10% | 3.45% | 10.93% |
Source: U.S. Bureau of Labor Statistics CPI for Food, U.S. City Average
Milk Inflation
The current fresh whole milk inflation rate for July 2022 is 14.59%.
Fresh Whole Milk Inflation Rate (1948 - 2022)
| Year | Jan | Feb | Mar | Apr | May | Jun | Jul | Aug | Sep | Oct | Nov | Dec |
|---|---|---|---|---|---|---|---|---|---|---|---|---|
| 2021 | 6.61% | 5.38% | 3.08% | 5.51% | 8.94% | 11.23% | 11.43% | 4.52% | 3.97% | 8.37% | 7.18% | 5.88% |
| 2022 | 9.20% | 15.05% | 17.00% | 16.39% | 20.22% | 16.76% | 14.59% | To be released | ||||
| 2017 | 2018 | 2019 | 2020 | 2021 | |
|---|---|---|---|---|---|
| Jan | -1.30% | -1.21% | 6.06% | 11.86% | 4.52% |
| Feb | -2.70% | -1.64% | 7.34% | 11.15% | 3.97% |
| Mar | -4.67% | 0.33% | 7.07% | 8.37% | 8.37% |
| Apr | -2.91% | -1.58% | 10.84% | 7.40% | 7.18% |
| May | -3.38% | -9.57% | 11.74% | 10.88% | 5.88% |
| Jun | -4.43% | -1.62% | 11.67% | 6.61% | 9.20% |
| Jul | -4.36% | -0.79% | 10.21% | 5.38% | 15.05% |
| Aug | -5.05% | 1.41% | 10.33% | 3.08% | 17.00% |
| Sep | -3.22% | 1.92% | 9.63% | 5.51% | 16.39% |
| Oct | -3.69% | 1.51% | 8.34% | 8.94% | 20.22% |
| Nov | -2.15% | 6.15% | 4.72% | 11.23% | 16.76% |
| Dec | -2.83% | 6.76% | 7.39% | 11.43% | 14.59% |
Average Cost of a Gallon of Milk (1996 - 2022)
Egg Inflation
The current egg inflation rate for July 2022 is 78.81%.
The average price of a dozen eggs is published by the Bureau of Labor Statistics once per month. For July 2022, the average price of a dozen eggs was $2.94. This is the average cost for organic, non-organic, cage-free, free-range, and traditional Grade A large eggs.
Egg Inflation Rate by Month (1981 - 2022)
| Year | Jan | Feb | Mar | Apr | May | Jun | Jul | Aug | Sep | Oct | Nov | Dec |
|---|---|---|---|---|---|---|---|---|---|---|---|---|
| 2021 | 0.34% | 10.21% | 6.56% | -19.76% | -0.91% | 5.66% | 17.20% | 28.69% | 35.62% | 29.33% | 18.48% | 20.73% |
| 2022 | 31.58% | 25.55% | 25.91% | 55.56% | 76.18% | 64.86% | 78.81% | To be released | ||||
| 2017 | 2018 | 2019 | 2020 | 2021 | |
|---|---|---|---|---|---|
| Jan | -6.05% | 18.65% | -24.85% | 8.94% | 28.69% |
| Feb | -3.33% | 16.10% | -16.23% | -2.17% | 35.62% |
| Mar | 10.79% | 7.79% | -22.77% | 9.83% | 29.33% |
| Apr | 14.00% | 5.98% | -11.97% | 3.20% | 18.48% |
| May | 31.24% | -12.12% | -3.76% | -3.52% | 20.73% |
| Jun | 10.63% | -12.15% | -5.98% | 0.34% | 31.58% |
| Jul | 19.88% | -11.28% | -6.94% | 10.21% | 25.55% |
| Aug | 30.41% | -15.67% | -1.23% | 6.56% | 25.91% |
| Sep | 47.69% | -29.70% | 38.00% | -19.76% | 55.56% |
| Oct | 40.52% | -31.45% | 20.41% | -0.91% | 76.18% |
| Nov | 22.22% | -26.11% | 29.18% | 5.66% | 64.86% |
| Dec | 29.41% | -27.94% | 12.71% | 17.20% | 78.81% |
Average Cost of a Dozen Eggs (1981 - 2022)
Gas Inflation
The current gas inflation rate for July 2022 is 44.36%. Besides other months in 2021, the last time gas inflation was above 55% was in April 1980.
The average price of a gallon of unleaded regular gasoline is published by the Bureau of Labor Statistics once per month. For July 2022, the average price of a gallon of gas was $4.67. This is the average cost for unleaded regular gas in 75 U.S. cities for one gallon (3.785 liters).
Gas Inflation Rate by Month (1977 - 2022)
| Year | Jan | Feb | Mar | Apr | May | Jun | Jul | Aug | Sep | Oct | Nov | Dec |
|---|---|---|---|---|---|---|---|---|---|---|---|---|
| 2021 | -9.39% | 1.26% | 23.11% | 51.33% | 58.17% | 51.93% | 48.58% | 49.52% | 48.88% | 56.79% | 66.60% | 57.20% |
| 2022 | 46.73% | 43.91% | 54.50% | 50.44% | 54.91% | 60.37% | 44.36% | To be released | ||||
| 2017 | 2018 | 2019 | 2020 | 2021 | |
|---|---|---|---|---|---|
| Jan | 10.16% | 20.56% | -7.23% | -18.00% | 49.52% |
| Feb | 19.11% | 9.24% | -8.46% | -16.62% | 48.88% |
| Mar | 10.74% | 16.22% | -7.41% | -19.23% | 56.79% |
| Apr | 16.51% | 4.83% | -1.91% | -20.23% | 66.60% |
| May | 10.27% | -1.83% | 7.17% | -16.20% | 57.20% |
| Jun | 8.00% | -9.85% | 12.15% | -9.39% | 46.73% |
| Jul | 12.01% | -8.62% | 4.76% | 1.26% | 43.91% |
| Aug | 10.72% | -0.31% | -11.58% | 23.11% | 54.50% |
| Sep | 13.19% | 3.58% | -33.83% | 51.33% | 50.44% |
| Oct | 21.84% | -0.21% | -35.23% | 58.17% | 54.91% |
| Nov | 24.69% | -5.56% | -24.56% | 51.93% | 60.37% |
| Dec | 25.95% | -3.38% | -21.61% | 48.58% | 44.36% |
Average Cost of a Gallon of Gas (1977 - 2022)
The U.S. Energy Information Administration (EIA) has a weekly Gasoline and Diesel Fuel Update that is released every Monday at 8:00 am. This survey is based on 900 retail gas outlets to find the average price of a gallon of gas in the United States. Average gasoline prices can be found for specific regions, such as the East Coast, Midwest, and West Coast, for specific states, and for specific cities.
The average cost a gallon of gas for the week of January 17, 2022 was $3.306. That's a $0.927 increase from one year ago. In California, the average cost of a gallon of gas was $4.497, up $1.284 for one year ago. In San Francisco, the average cost was $4.642 per gallon of gas, up $1.311 from last year.
Healthcare Inflation
The current healthcare inflation rate for July 2022 is 3.21%.
The cost of healthcare, calculated as part of the medical care index, includes the cost of prescription and non-prescription drugs, physician services, dental services, eyeglasses and eye care, hospital services, nursing homes, and health insurance.
Healthcare Inflation Rate (1984-2022)
| Year | January-June | July-December |
|---|---|---|
| 2019 | 1.88% | 3.77% |
| 2020 | 4.77% | 3.45% |
| 2021 | 1.42% | 1.05% |
| 2022 | 3.21% | To Be Released |
| Year | Jan-Jun | Jul-Dec |
|---|---|---|
| 2012 | 3.76% | 2.73% |
| 2013 | 2.20% | 2.41% |
| 2014 | 2.37% | 2.61% |
| 2015 | 2.65% | 3.24% |
| 2016 | 4.33% | 3.19% |
| 2017 | 1.85% | 2.13% |
| 2018 | 1.82% | 1.88% |
| 2019 | 3.77% | 4.77% |
| 2020 | 3.45% | 1.42% |
| 2021 | 1.05% | 3.21% |
Electricity Inflation
The current electricity inflation rate for July 2022 is 11.74%.
Electricity Inflation Rate (1985 - 2022)
| Year | January-June | July-December |
|---|---|---|
| 2019 | 0.14% | 0.27% |
| 2020 | 0.25% | 0.92% |
| 2021 | 2.99% | 5.63% |
| 2022 | 11.74% | To Be Released |
| Year | Jan-Jun | Jul-Dec |
|---|---|---|
| 2012 | -1.09% | 1.15% |
| 2013 | 3.03% | 3.91% |
| 2014 | 3.35% | 1.77% |
| 2015 | -0.61% | -2.04% |
| 2016 | -0.07% | 2.03% |
| 2017 | 2.27% | 1.47% |
| 2018 | -0.04% | 0.14% |
| 2019 | 0.27% | 0.25% |
| 2020 | 0.92% | 2.99% |
| 2021 | 5.63% | 11.74% |
The current average electricity cost per kilowatt-hour for December 2021 is $0.142 per kWh.
Electricity Average Cost per Kilowatt-Hour (1978 - 2022)
Housing Inflation
The current housing inflation rate for July 2022 is 7.37%. That is the highest that housing price inflation has been since the 1990’s.
Housing Inflation Rate (1968 - 2022)
Housing Prices Over Time (1963 - 2022)
Inflation Calculator Data Sources
The CPI, residential US real estate, and S&P data is from Robert J. Shiller’s dataset and the S&P CoreLogic Case-Shiller Home Price Indices.
NASDAQ Composite Index data is from the Federal Reserve Bank of St. Louis (FRED).
Dow Jones Industrial Average (DJIA) data is from MeasuringWorth.
Gold benchmark prices are from the National Mining Association and the World Gold Council.
Breakeven inflation rates, which are used for daily inflation data, is from the Federal Reserve Bank of St. Louis (FRED).
- Any analysis or commentary reflects the opinions of Casaplorer.com (a part of Wowa Leads Inc.) analysts and should not be considered financial advice. Please consult a licensed professional before making any decisions.
- The calculators and content on this page are for general information only. Casaplorer does not guarantee the accuracy and is not responsible for any consequences of using the calculator.
- Interest rates are sourced from financial institutions' websites.